
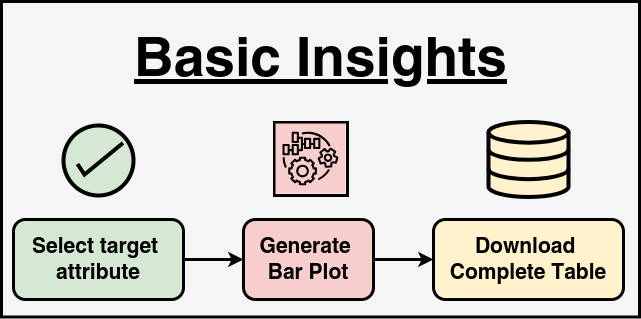
This module is designed to provide basic insights and analytics on Kisan Call Center Data. It allows users to select a specific attribute (such as Category, Year, Month, Crop, QueryType, Season, Sector, or StateName) and generates a count-based analysis of that attribute’s values from the database. The results are presented in a bar chart making it visually easy to interpret. One of the main features of this page is the ability to download the data in CSV format, enabling further offline analysis. This is especially useful for researchers, policymakers, and agricultural experts who need to work with large datasets. The download feature ensures that users can obtain a structured dataset without manually extracting information.
By integrating real-time database querying, the page dynamically retrieves the latest information available, ensuring accurate and up-to-date insights. It is particularly useful for agricultural decision-making, helping organizations analyze trends in crop production, seasonal variations, and query patterns from farmers or researchers. This module can assist government agencies, research institutes, and agribusinesses in identifying patterns in agriculture-related queries. It can also be used for predictive analytics, allowing stakeholders to make data-driven decisions for agricultural planning. Overall, the module simplifies data exploration and visualization, making it an essential tool for anyone working with agricultural datasets.
Home  Clear Analysis
Developed by ICAR-IASRI, New Delhi, India