
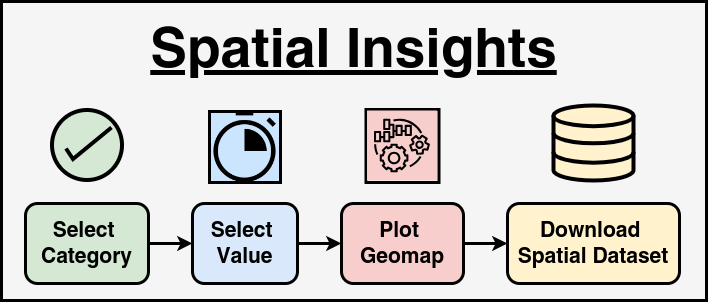
This module is designed to help users analyze and visualize spatial data based on selected categories and values. It explores the Kisan Call Center dataset containing location-based records and allows users to filter the data using predefined categories such as "Year," "Crop," "QueryType," and "StateName." When a user selects a category, the page retrieves and displays unique values associated with that category. The user can then choose a specific value, and the page will count how many records match that selection. This count is displayed to the user, providing insight into the distribution of data for the chosen attribute.
Additionally, the module includes options for downloading spatial data in CSV format, allowing users to export location-based records for further analysis. If the selected category and value have associated geographical coordinates, the system enables map visualization. Users can click a button to fetch and display map data, where each location is represented as a circle marker. The intensity of the markers is determined based on the log-scaled count of occurrences, providing a heatmap-like effect to highlight regions with higher concentrations of data.
This tool is particularly useful for researchers, agricultural analysts, and policymakers who need to examine spatial trends in their data. By visualizing geolocations, users can identify patterns, hotspots, or regional variations in specific queries. The interactive dropdown menus and automated map plotting enhance usability, making data exploration more intuitive. Overall, this module serves as an efficient solution for managing and interpreting location-based information, aiding in decision-making and strategic planning.
Home  Clear Analysis
Developed by ICAR-IASRI, New Delhi, India