
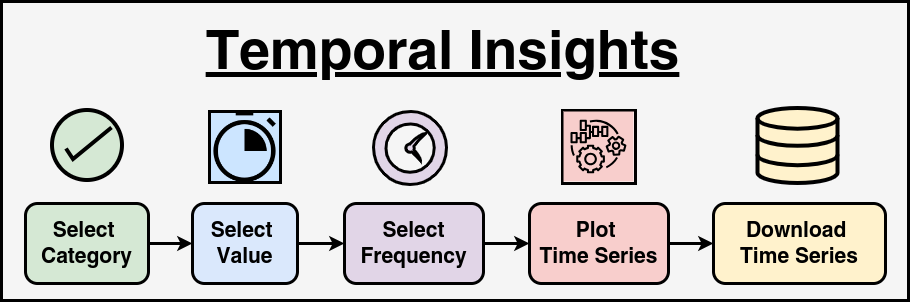
This module is designed for extracting and visualizing time series data from the Kisan Call Center Dataset. It enables users to select a specific category (such as Year, Crop, QueryType, or StateName) and retrieve unique values associated with the chosen category. Once a value is selected, the module allows users to generate time-series data either on a yearly or monthly basis. The extracted data can be downloaded as a CSV file or visualized using a line chart.
The module is particularly useful for researchers, analysts, and agricultural professionals who need to analyze trends over time. It can help government agencies, agronomists, and data scientists track agricultural query trends, understand seasonal variations, and make informed decisions based on historical data. The CSV download feature allows users to store and share extracted time-series data for further offline analysis in Excel or other statistical tools.
The chart visualization makes trend analysis easier by representing data in an intuitive manner. Users can compare different years or months to identify patterns, such as seasonal variations in crop-related queries. This module is also compatible with web applications, making it a valuable tool for online dashboards where users can interactively analyze agricultural or business data. In summary, this module serves as a versatile and efficient tool for time-series data extraction and visualization. It is ideal for organizations, researchers, and decision-makers looking to analyze trends over time with a user-friendly and automated approach.
Home  Clear Analysis
Developed by ICAR-IASRI, New Delhi, India