
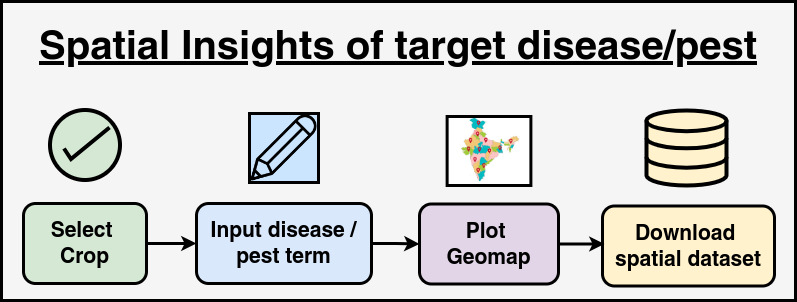
This module is designed for agricultural researchers, policymakers, and farmers who need spatial insights into crop diseases and pests. It allows users to select a crop and enter a specific disease or pest name to retrieve relevant data. The module then fetches the number of cases related to the selected crop and disease from the Kisan Call Center Dataset and provides an option to download spatial data as a CSV file. Additionally, users can visualize the geographical spread of the disease/pest. Users can download a CSV file containing location-based insights, including latitude, longitude, district name, and state name.
For users interested in visualizing the spatial distribution, the module provides a “Plot Geomap” button. Clicking this button generates an interactive geo-map displaying affected regions. The map uses circle markers to represent data points, with color intensity indicating the severity (i.e., higher case counts result in darker markers). This helps users easily identify hotspots of disease outbreaks. The module is particularly beneficial for agriculture experts, government agencies, and researchers looking to analyze disease trends and take preventive actions. Farmers can also use this tool to understand regional threats and take appropriate protective measures. Furthermore, agritech companies can integrate this tool into larger decision-support systems to develop predictive models based on spatial disease patterns.
Home  Clear Analysis
Developed by ICAR-IASRI, New Delhi, India