
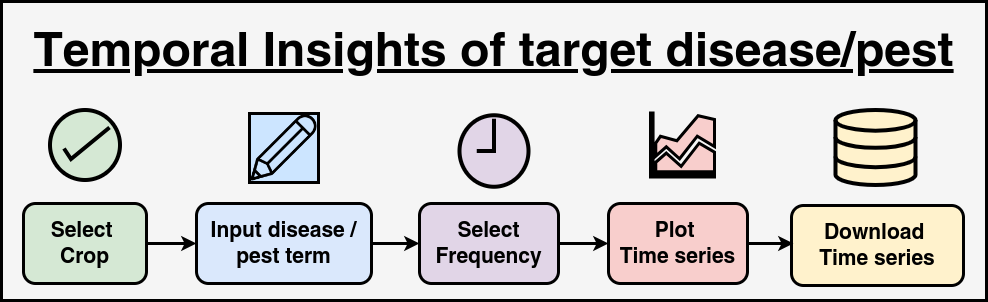
This module is designed to help researchers, agronomists, and policymakers analyze the frequency of disease and pest-related queries for different crops over time. By selecting a crop and specifying a disease or pest name, users can generate time-series data in either yearly or monthly formats. The data is visually represented using an interactive line chart, making it easier to observe trends and patterns. Additionally, users can download the dataset in CSV format for further analysis.
Farmers and agricultural extension officers can benefit from this tool by identifying periods of high disease or pest occurrences, allowing them to take preventive measures. Researchers studying plant pathology can use the module to correlate outbreaks with environmental factors. Government agencies and agritech companies can leverage the insights to enhance early warning systems and optimize resource allocation for pest and disease control. The built-in filtering mechanism ensures that only relevant data is processed, improving performance. This system is particularly useful in regions where agricultural diseases significantly impact crop yield and food security. By analyzing past trends, stakeholders can make informed decisions to mitigate risks and improve overall crop health. The tool's ability to generate downloadable reports further enhances its utility for academic research and policymaking.
Home  Clear Analysis
Developed by ICAR-IASRI, New Delhi, India